GEPlot 2.1

Allows to select colours, width, height and opacity of grids
Rating
Your vote:
Latest version:
2.1.31.0 See all
Developer:
Screenshots
1 / 1
Shareware
Download
3.7 MB

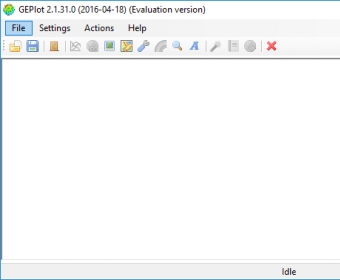
GEPlot is a Windows application for plotting contour lines and grids in Google Earth. With GEPlot you can plot your geographical data both over a small domain and over the whole world. GEPlot produces KML and KMZ files that can be loaded in Google Earth. The input can be ASCII (X,Y,Z format or Golden Software Surfer GRD format) files or Microsoft Excel files organised as X,Y,Z columns. GEPlot allows to produce grid and contour plots for any georeferenced variable, such as, for example, orography, land use, air pollution levels, noise levels, population data, etc.
Comments

User

Your vote:

Related software

Kannada ASCII Unicode Converter
Free
rating

You can convert ASCII Unicode characters to Hexadecimal.

Veusz
Veusz
Free
rating

GUI scientific plotting and graphing package.

GraphExpert Professional
rating

GraphExpert Pro is a cross-platform solution for publication-quality graphing.

Contour for Windows
Contour for Windows
rating

It is an application for screenwriter to write unique story outlines.

AlaVar
AlaVar
Free
rating

The program computes the three Allan Standard Deviations of a Time series.

Tags

Google Earth Produce contour plots Plot geographical data Plot files ASCII files